

In the world of technical analysis, few patterns are as widely recognized and reliable as the Head and Shoulders.
This classic chart pattern is often considered a powerful indicator of potential trend reversals, making it a valuable tool for traders aiming to anticipate market shifts. In this guide, we’ll explore what the Head and Shoulders pattern is, how to identify it, and how to trade it effectively.
What is the Head and Shoulders Pattern?
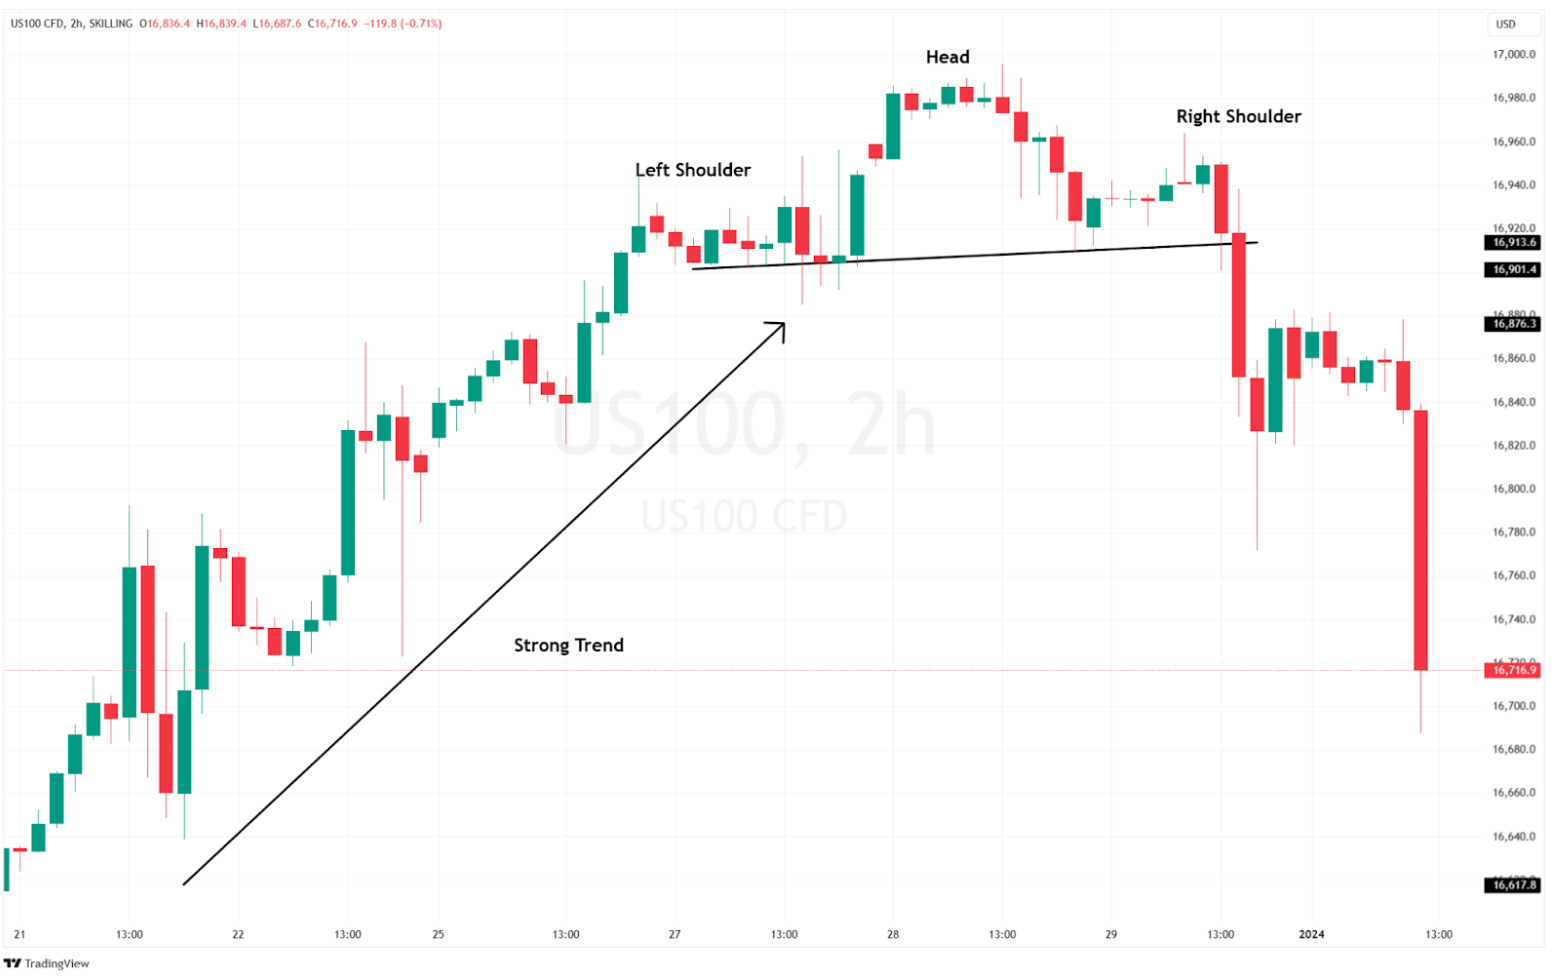
The Head and Shoulders pattern is a reversal pattern that can occur after an upward or downward trend. It signals a potential change in direction from bullish to bearish or vice versa, depending on its formation. The pattern consists of three peaks:
- The Left Shoulder: The price rises to a peak, followed by a decline.
- The Head: The price rises again to a higher peak, followed by another decline.
- The Right Shoulder: The price rises again, but this time to a lower peak, similar to the left shoulder, followed by a final decline.
The pattern is completed by a “neckline,” which is drawn by connecting the lows of the two troughs between the shoulders and the head. The neckline serves as a key level of support (in an uptrend) or resistance (in a downtrend).
Types of Head and Shoulders Patterns
There are two main types of Head and Shoulders patterns:
- Head and Shoulders Top (Bearish Reversal):
- This pattern appears after an upward trend and signals a potential reversal to the downside. The three peaks form with the head as the highest point, and when the price breaks below the neckline, it indicates a bearish reversal.
- Inverse Head and Shoulders (Bullish Reversal):
- This pattern forms after a downward trend and suggests a potential reversal to the upside. Here, the three troughs form with the head as the lowest point, and a break above the neckline signals a bullish reversal.
How to Identify the Head and Shoulders Pattern
Identifying the Head and Shoulders pattern requires careful analysis of the price chart. Here’s how to spot it:
- Left Shoulder: Look for a peak followed by a decline in price. This forms the first shoulder.
- Head: The price rises again to a higher peak than the left shoulder and then declines again. This peak is the head of the pattern.
- Right Shoulder: The price rises once more, but this peak is lower than the head and typically aligns with the left shoulder, forming the right shoulder.
- Neckline: Draw a line connecting the lows (for the Head and Shoulders Top) or highs (for the Inverse Head and Shoulders) between the left shoulder and the head. This is your neckline.
- Breakout Point: The pattern is confirmed when the price breaks through the neckline after forming the right shoulder. In a Head and Shoulders Top, a break below the neckline signals a bearish move. In an Inverse Head and Shoulders, a break above the neckline suggests a bullish reversal.
How to Trade the Head and Shoulders Pattern
Once you’ve identified the pattern, trading it can be straightforward if you follow these steps:
- Entry Point:
- For a Head and Shoulders Top, enter a short position when the price breaks below the neckline.
- For an Inverse Head and Shoulders, enter a long position when the price breaks above the neckline.
- Some traders wait for a retest of the neckline after the breakout as a confirmation before entering the trade.
- Stop-Loss Placement:
- Place your stop-loss just above the right shoulder for a Head and Shoulders Top to protect against false breakouts.
- For an Inverse Head and Shoulders, place the stop-loss just below the right shoulder.
- Target Price:
- To estimate the target price, measure the vertical distance from the head to the neckline. Subtract this distance from the neckline for a Head and Shoulders Top, or add it to the neckline for an Inverse Head and Shoulders.
- This measured move gives you a potential profit target for the trade.
- Volume Consideration:
- Ideally, volume should decrease during the formation of the pattern and increase during the breakout. This volume increase adds validity to the breakout and signals a higher probability of a successful trade.
Practical Tips for Trading the Head and Shoulders Pattern
- Patience is Key: The Head and Shoulders pattern can take time to form completely. Ensure the pattern is fully developed before making your move.
- Use Other Indicators: Combine the Head and Shoulders pattern with other technical indicators like RSI, MACD, or moving averages to strengthen your trade signals.
- Consider Market Conditions: While this pattern is reliable, broader market trends and conditions can affect its success. Make sure to analyze the overall market sentiment before entering a trade.
Final thoughts
The Head and Shoulders pattern is a reliable tool for predicting market reversals, but like all technical patterns, it requires practice to identify and trade effectively.
By understanding its structure and combining it with sound risk management strategies, you can enhance your trading performance and make more informed decisions.
At Trade24Seven, we’re dedicated to providing you with the knowledge and tools to succeed in the markets. Keep exploring, keep learning, and stay tuned for more insightful trading guides.